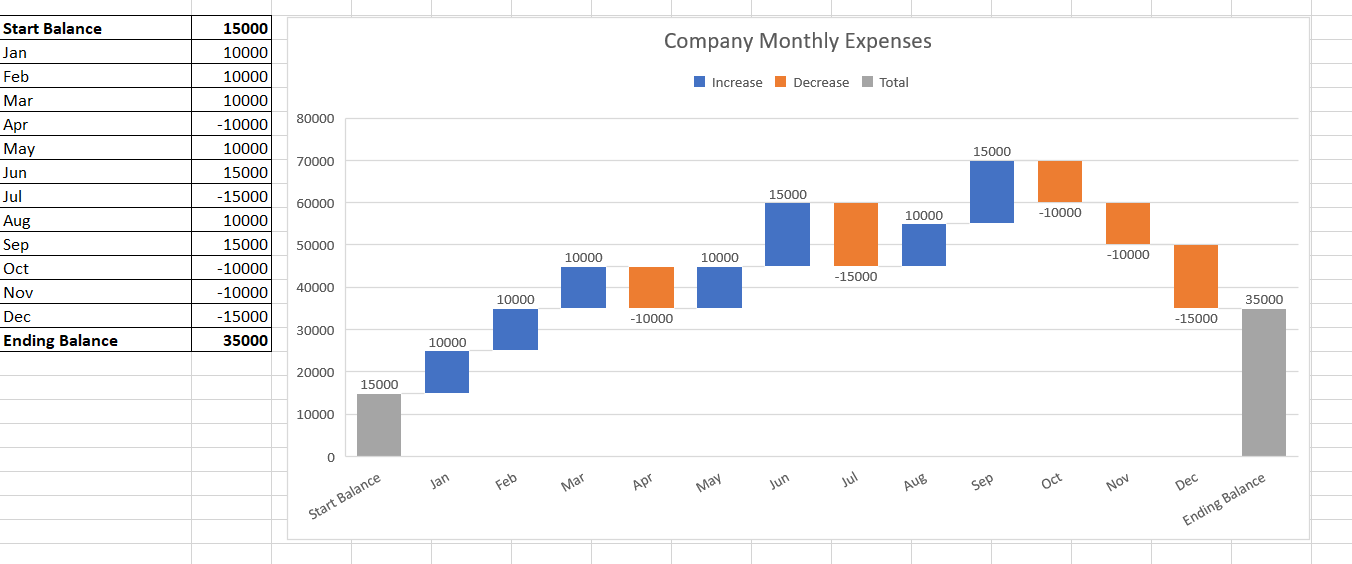
Waterfall Chart
Waterfall chart is a chart that visualizes performance over time with a series of columns.
- aka cascade chart
- use cases:
- tracking operating expenses, cash flow, or growth in customers or investments
- visualizes how the money flows through from starting balance to ending balance
- time period is set on the x-axis while the financial value is set on the y-axis