Standard Deviation
Standard deviation is a statistical measure of variability that uses all the data points in the data set and shows how dispersed the data is in relation to the mean.
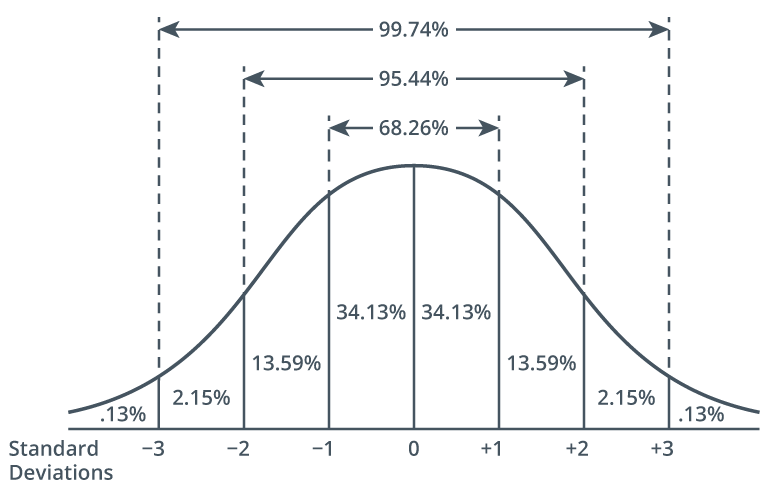
- in a normal distribution, the empirical rule refers to the tendency of most data points to fall within three points of the mean either on the positive side or the negative side of the curve
- low standard deviation indicates that the values are closer to the mean
- high standard deviation tells you the values are more spread out and thus further from the mean
- represented by:
(sigma) for population (Latin letter s) for sample
- formula:
= each of the values of the data - x-bar = the mean
is the number of data points - sigma is used to denote a sum
- Steps to calculate:
- For each value in the data set, subtract the mean and square that number
- Then, add together the results of these calculations and divide that sum by the total number of values in the data set minus one
- result of this calculation represents the variance
- the average squared distance from the mean of the data for a single data point
- result of this calculation represents the variance
- Determine the standard deviation by taking the square root of the variance