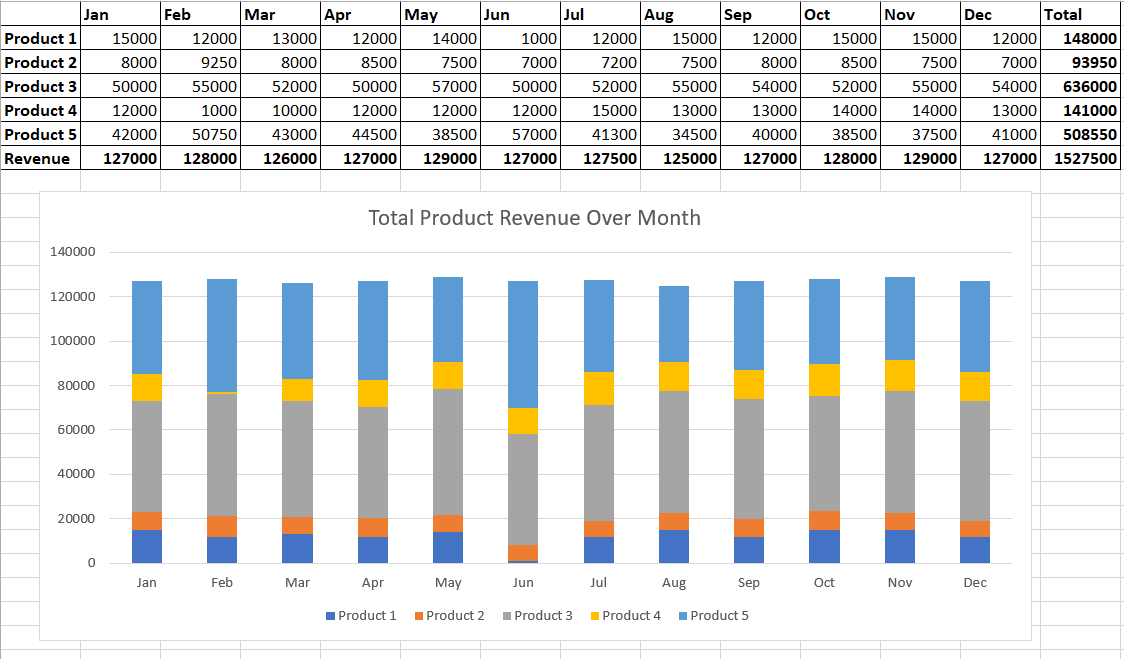
Stacked Chart
Stacked chart is a chart that breaks the bar or column into separate portions, each representing an additional data point.
- allows us to compare something within a category
- helps us more easily compare values for a data point across categories