Scatter Plot
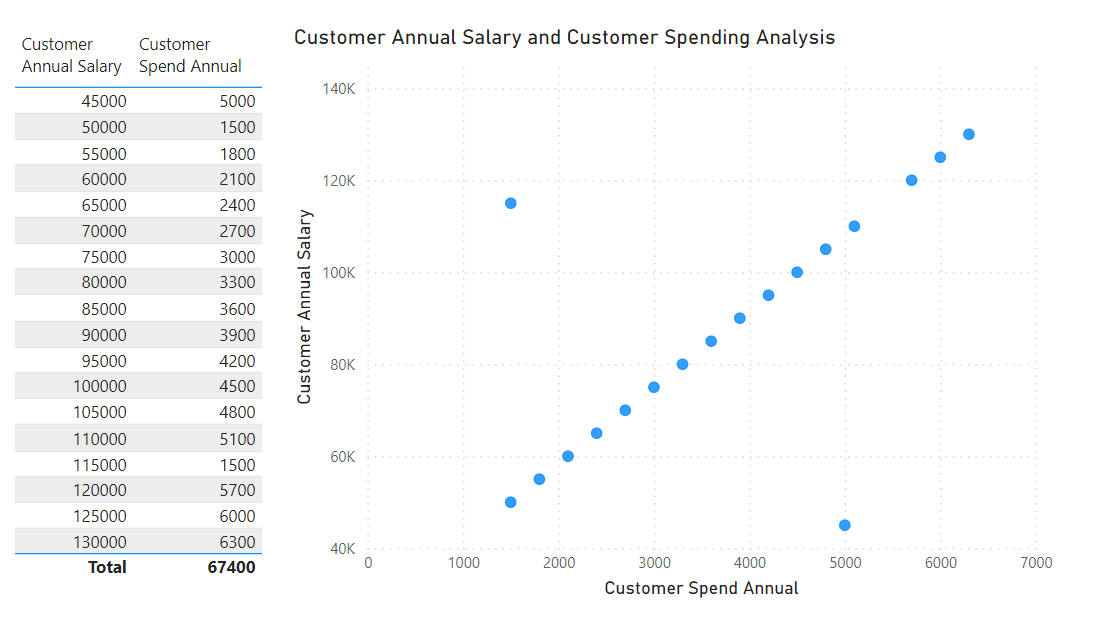
Scatter plot is a visual that consists of two variables plotted on the x-axis and y-axis, with a dot placed on the graph where the two data points converge on both of the axes.
- help us determine whether there is a relationship between two variables
- especially useful when we want to spot outliers
- can analyze the layout of the dots to determine whether there is any correlation between these two variables