Pivot Table
Pivot table is a data analysis tool that summarizes, organizes, and reorganizes large datasets to reveal patterns and insights by automatically grouping and aggregating selected values.
- displays of data that are shown in a table format
- can range in complexity depending on the analysis
- allow us to visualize groups within groups
- putting data into a pivot table unlocks the ability to visualize this data in a pivot chart
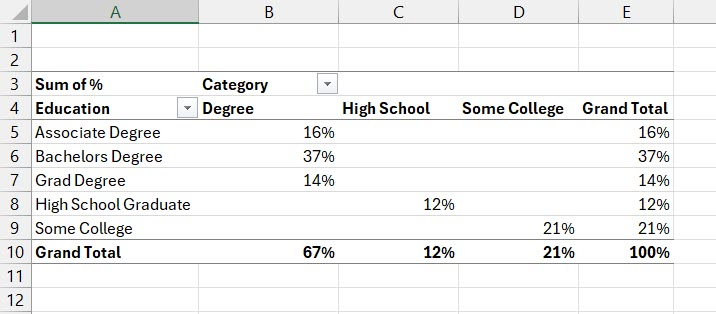
Example Pivot Table
- displays data by two categories at a cross section
- Associates Degree, or the education, is the row, and the Education Type is the column
- pivot gives us a grouping of the degrees and then creates the two additional groups that are not associated with a degree
- grouping allows us to see degree, high school, and some college, so a little higher-level category of the data