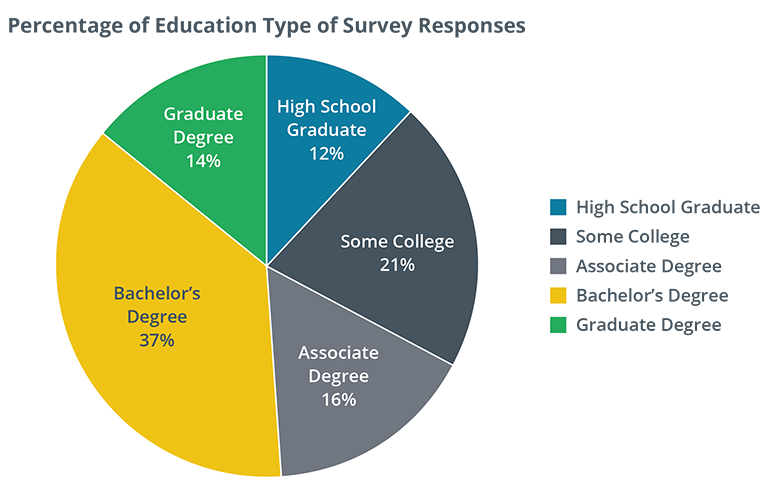
Pie Chart
Pie chart is a circle broken into slices to represent percentages of information.
- easy to understand
- gives us a proportional visual for a whole group of records
- the more slices you have, the harder it can be to distinguish the differences between each slice