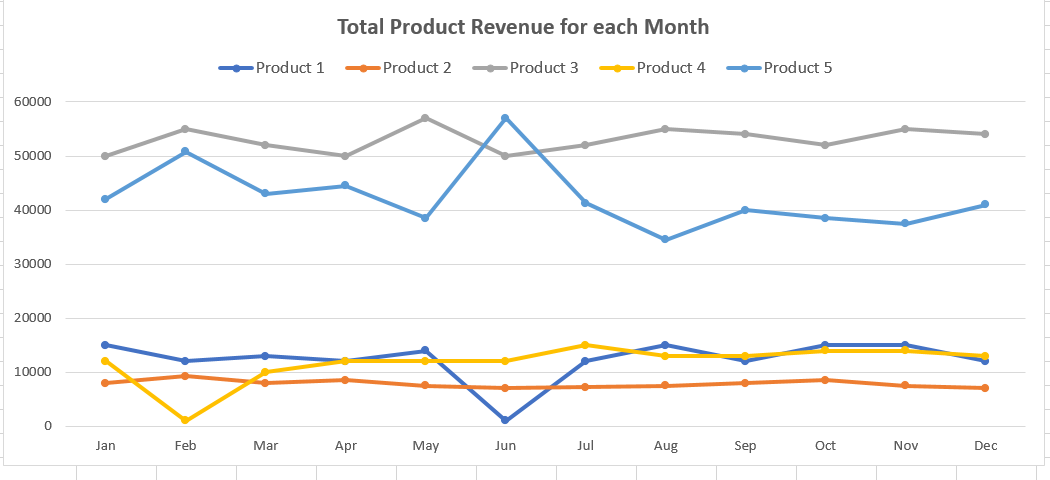
Line Graph
Line graph a graph that consists of either a single horizontal line or a group of multiple lines that represent different data points at different times.
- aka run chart
- typically the visual of choice when we want to look at time series data
- the connected line makes it easier to see exactly how that data changes over time
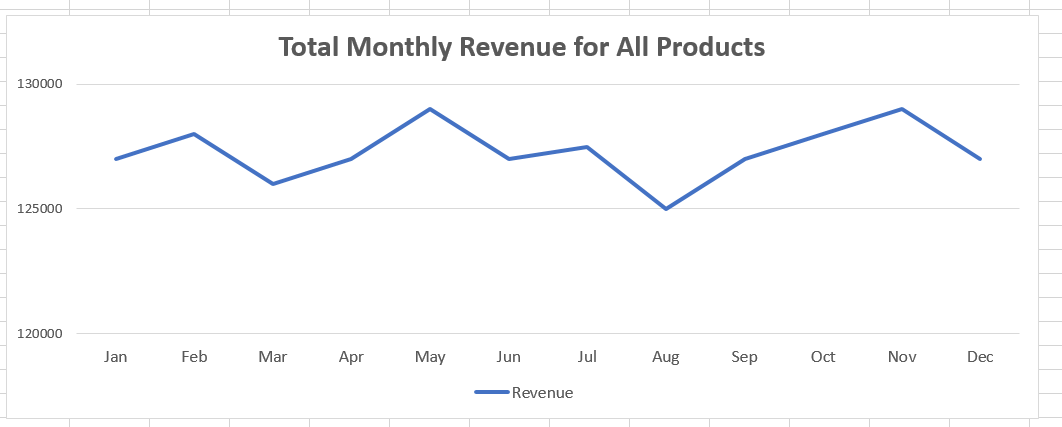
- add markers to emphasize certain points on the line graph
- often a dot or a square placed on the line
- can display information on hover
Multiple Lines
- can use a line chart to portray multiple data points by added multiple lines
- use different colored lines to differentiate
- e.g., multiple products’ revenue over time