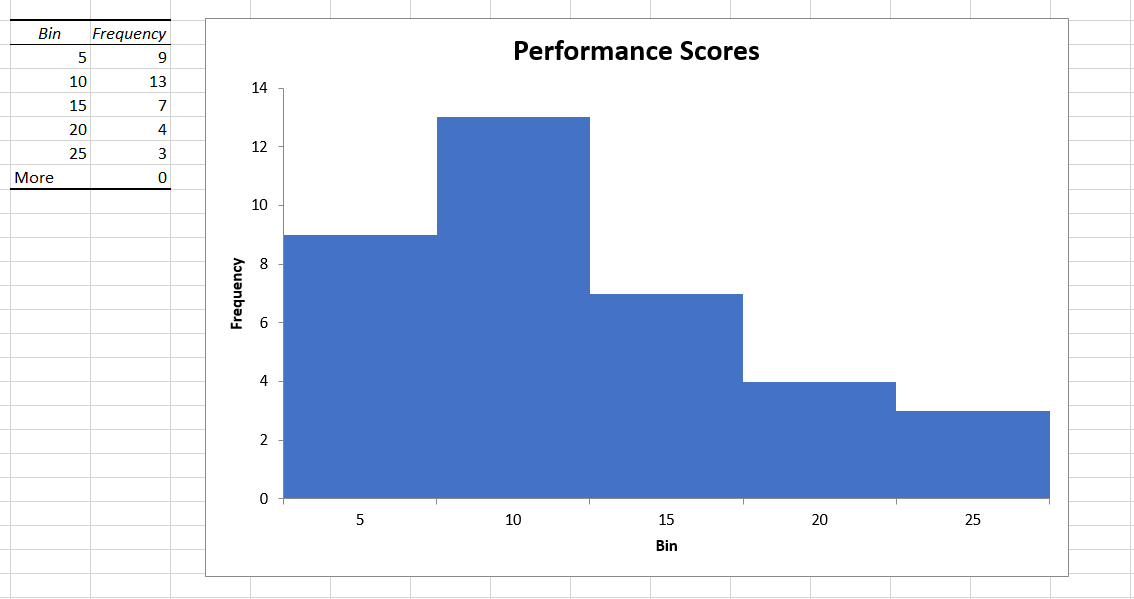
Histogram
Histogram is a quality control tool that organizes individual measured values in a data set according to the frequency (number or percentage) of occurrence.
- similar to a column chart
- but the key differentiator is the ability to show a frequency of values that are grouped by bins, or class intervals
- gives you an immediate picture of the spread or dispersion of your data
- Each bin is aligned on the x-axis
- metric we want to assess against is listed on the y-axis
- size or height of each column portrays the volume of the numbers in each bin
- no space between the columns of a histogram
- 4 formatting best practices:
- Each bin should be the same size
- Outliers must be included in the bins
- consider the lowest number in your data set and the highest number, and then choose the size of your group accordingly
- Whole numbers should be used for both the start and end of the bin
- help make the chart easier to read
- The number of bins should not be exceedingly large
- ultimately depends on your volume of data
- Excel uses Sturges’ rule (1926)
- developed by Herbert A. Sturges
- uses a simplified approach to determining the number of bins based on the number of observations (data points)
- will create fewer, but wider, bins
- useful when working with decently-sized data sets
- automated bin-width rule developed by Freedman-Dianconis (1981)
- good for skewed data
- is resistant to outliers because it leverages interquartile range (IQR) and ignores extreme values
- David W. Scott’s Rule (1979)
- uses standard deviation to determine bin sizes
- works well for data that is normally distributed
- is sensitive to outliers