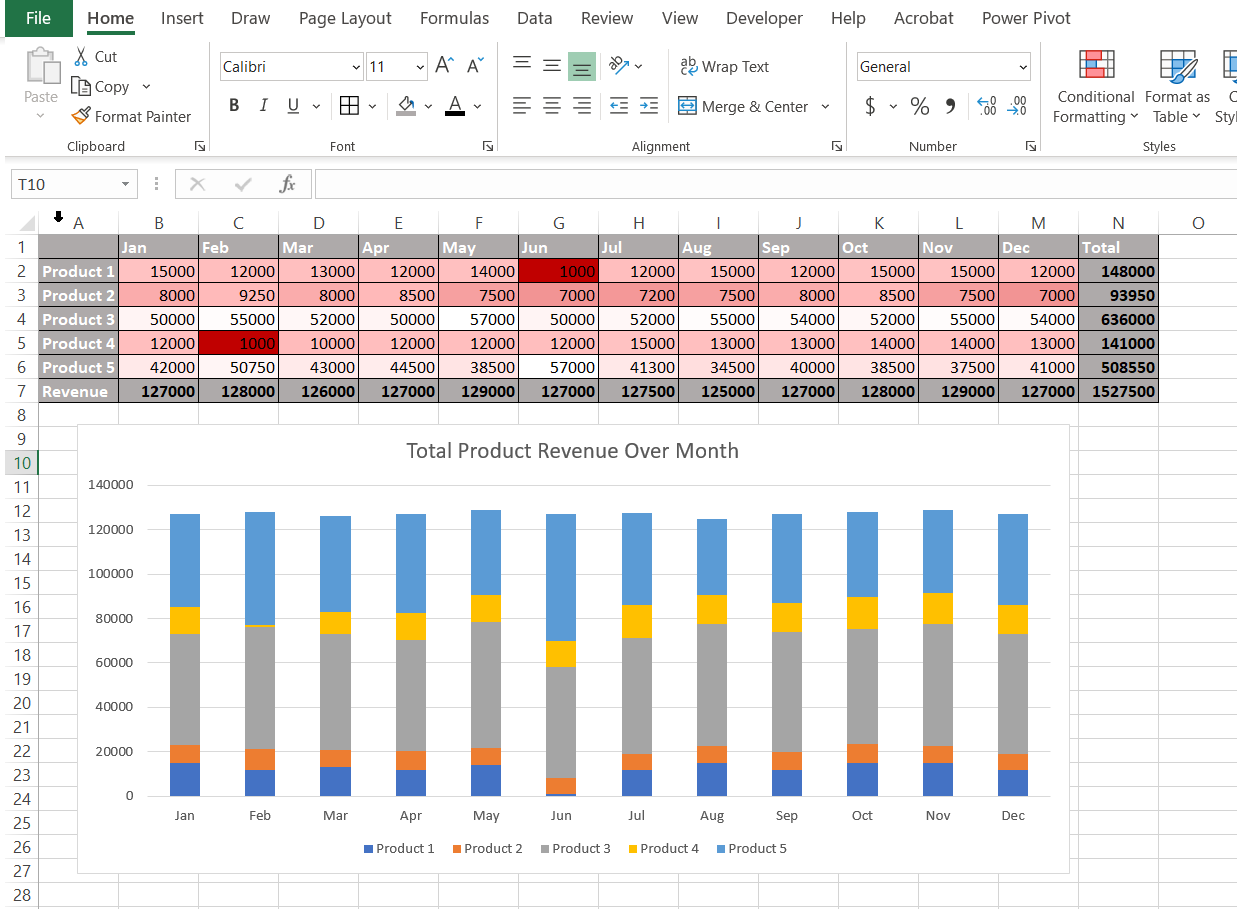
Heat Map
A heat map is any visual that uses color to draw attention to a “hot” spot, or a part of the visual that needs pointing out.
- can use color scales to point out a high or low number
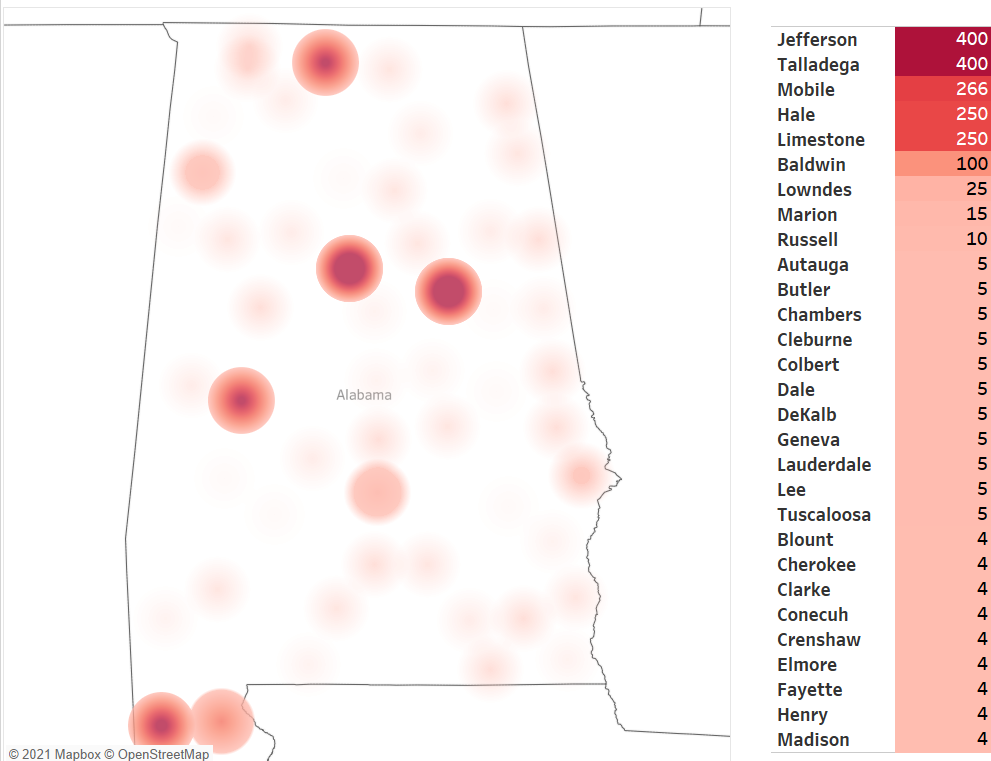
- can use color to draw attention to points on a geographic map
Geographical Heat Maps
- allow you to draw attention to points on a geographic map
Color Scales
- can use Color Scales with Conditional Formatting in Excel to create a heat map for values you want to draw attention to
- Color Scales can be an effective way to show that everything is progressing as it should