Frequency
Frequency is the number of times that a data point occurs within a data set.
- simple as grouping the data and counting it
- can use the SUBTOTAL command in Excel
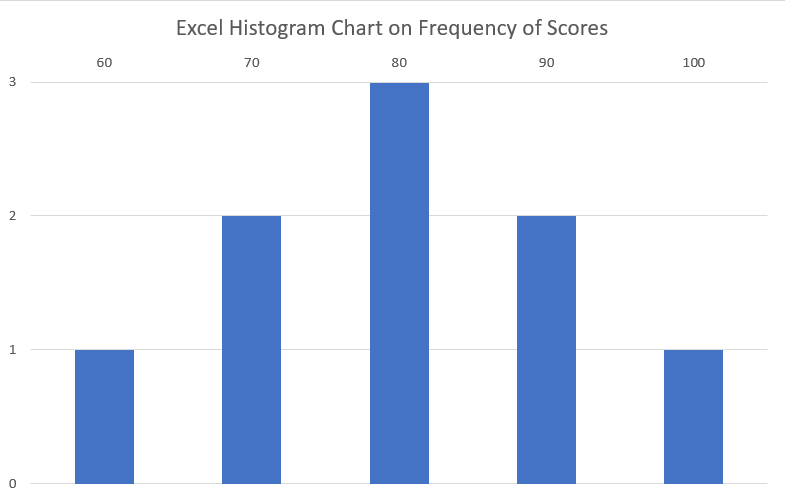
- can visualize frequency in a histogram
- shows an approximate distribution of data values
- divides the range of values into a set of intervals called bins
- can use IF functions to create values for binning or categorization
- can be visualized as a percentage value
- to calculate, divide the frequency for each score by the total of all values in the frequency column
k-means clustering is a process of finding natural groups within data traditionally a machine learning technique used for unsupervised data.
- can help begin the understanding of groups that exist in a data set
- first establish k, the number of groups to work with
- ML will establish the groups based on natural patterns detected in the data