Fishbone Diagram
Fishbone diagram is a cause-and-effect diagram that provides a structured method to identify and analyze potential causes of problems in a process or system.
- aka Ishikawa diagram or cause and effect diagram
- empty diagram looks like the bones of a fish
- simple tool that visualizes how various factors impact a single outcome
- has a single problem on the far right of the diagram
- On the left of the diagram are various branches representing categories of potential causes for the problem
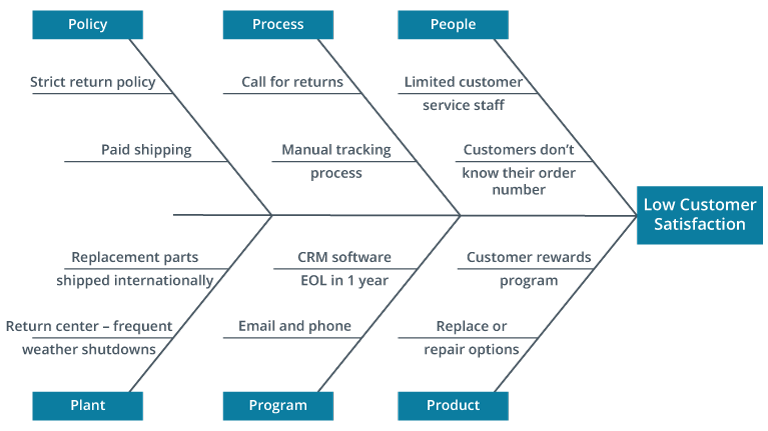
- categories are groupings of factors
- can use any category grouping that works for the project
- can also use the 6Ps, a standard category set:
- Policy: policies and procedures
- Process: informal and formal processes
- People: people and labor
- Plant: buildings, layouts, and locations
- Program: applications and software
- Product: products, services, and information