Critical Path Method (CPM)
Critical path method (CPM) is an analysis method that uses a sequential Finish-to-Start network logic and calculates one early and late start and finish date for each activity using a single-duration estimate.
- aka critical path analysis
- incorporates duration, activities, dependencies, PERT estimates, and additional calculations
- analyzes a project schedule to identify the dependent activity sequence with the longest duration
- sequence represents the shortest total project duration, known as the critical path
- to calculate the critical path:
- identify the longest chain of dependent activities
CPM Analysis Process
- Draw the project activities and dependencies
- Calculate the PERT estimate duration for each activity
- Complete a forward pass to calculate the early start and early finish
- Complete a backward pass to calculate the late start and late finish
- Calculate the total float (TF)
- Calculate the free float (FF)
- Identify the critical path
Step 1: Diagram the Activities
- Begin by creating a precedence diagram (or PDM diagram) of the project
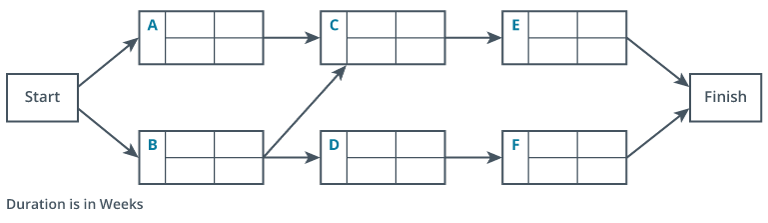
- PDM diagram with the basic activities listed
Step 2: Calculate the PERT Estimates
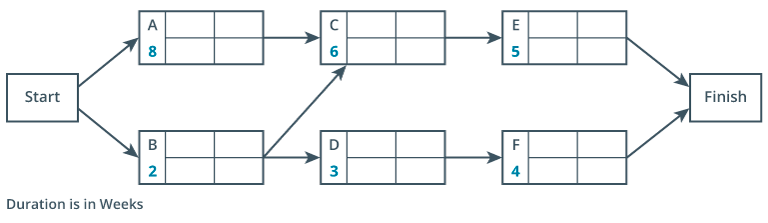
- calculate the PERT estimate duration for each activity
- Identify the optimistic, most likely, and pessimistic values for each activity
- Then, calculate the PERT estimates and add them to the chart
CPM Step 3: Complete a Forward Pass
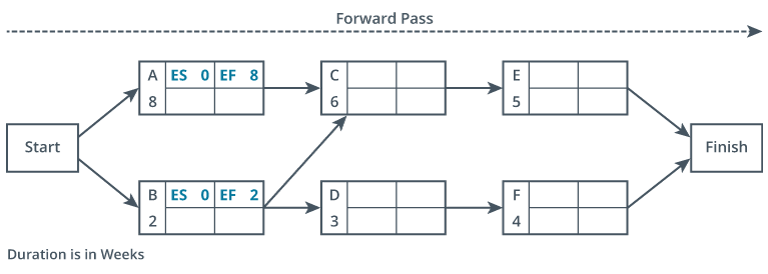
- A forward pass means you will start at the beginning of the project and move through the sequence of activities until you reach the end of the project
- calculate two values for each activity
- require data from an activity’s predecessors
- For each activity, you will calculate two values during the forward pass:
- Early Start (ES)
- the soonest an activity can start because of how long it will take to complete predecessor activities
- Early Finish (EF)
- the earliest an activity can finish because of how long it takes to complete it
- Early Start (ES)
Begin Calculations
- Locate the first activity after the project start
- Activity A and B are the leftmost activities
- Activity A has no predecessors, so the ES is 0
- work can begin immediately
- has a duration of 8
- Activity B has no predecessor and duration of 2
- Populate Activities A and B in the forward pass with ES and EF values
- Activity C has two predecessors:
- Activities A and B
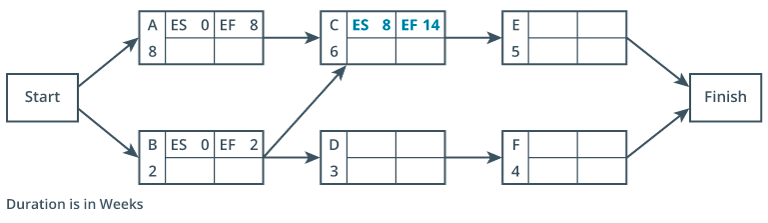
- Activity D has one predecessor: Activity B
- Activity E has one predecessor: Activity C
- Activity F has one predecessor: Activity D
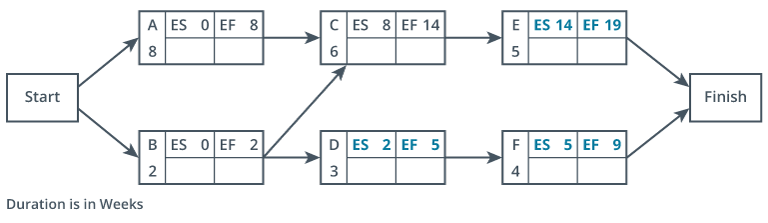
- As you move from start to finish, the EF and ES accumulate all the time from the previous activities
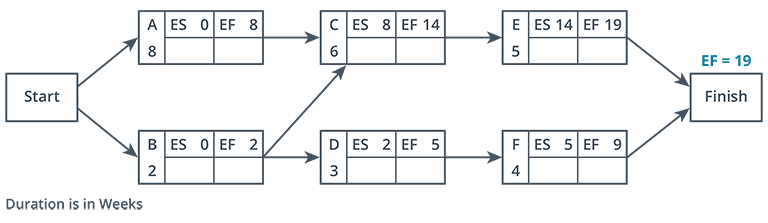
- largest value represents the total time needed for all the project activities
- can identify the earliest finish for the project after calculating the ES and EF for all the activities
- forward pass tells us that the earliest this project can finish is in 19 weeks
Step 4: Complete a Backward Pass
- backward pass means you will start at the end of the project and trace the dependencies backward until you reach the start of the project
- calculate two new values for each activity
- Late Start (LS)
- latest an activity can start and still allow the project to finish on time
- Late Finish (LF)
- latest an activity can finish and still allow the project to finish on time
- Late Start (LS)
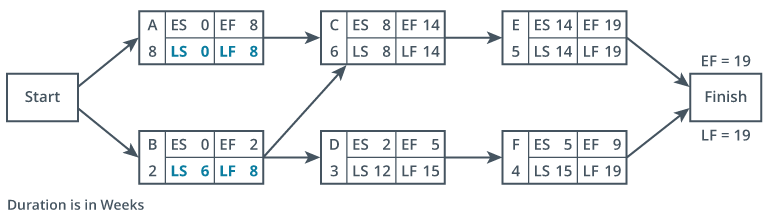
- You have calculated the ES, EF, LS, and LF for each activity. Now, you know how long the project should take based on the estimates
Step 5: Calculate the Total Float
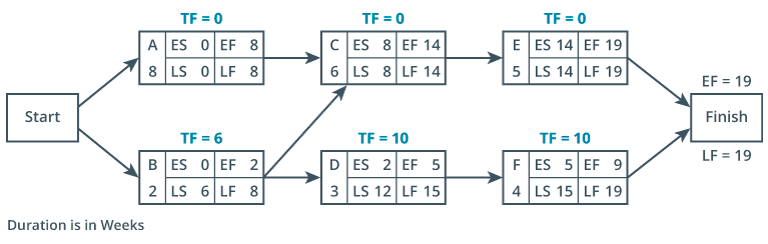
Total float (TF) is the amount of time an activity can wait to start without impacting the total project timeline.
- aka slack
- calculated for every activity
- TF measures how much an activity’s schedule can shift without affecting the entire project timeline
- two formula options:
Calculate Project Total Float
Step 6: Calculate the Free Float
Free float (FF) is the amount of time an activity can wait to start without impacting any other activities.
- is the amount of time an activity can delay without encroaching on the early start of any subsequent activities
- calculated for every activity
- formula:
- FF is always smaller than the TF for an activity
- if TF is 0, then FF is 0
Calculate Project Free Float
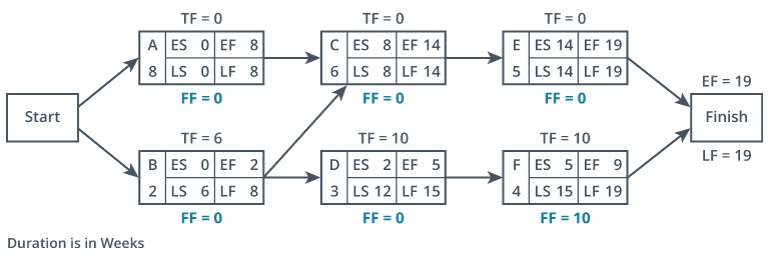
- TF sets fixed boundaries at the project start and finish
- entire project timeline can float left and right without crossing those boundaries
- FF narrows the space by setting fixed boundaries at the edges of each activity
- If we convert this example CPM diagram to a Gantt chart, we can visualize the effects of float
- activity can occur in any shaded or outlined region in the Gantt chart below, and the project will still finish on time
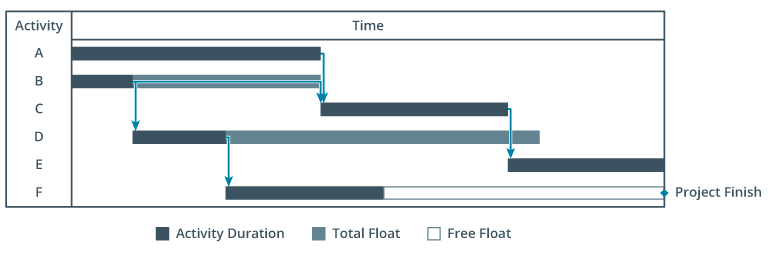
- can see that Activity D has plenty of room to float out if it needs to
- if it moves out even one week, it will nudge Activity F’s start time
- nudging means Activity D has TF but not FF
- Activity F has both TF and FF
- since it has no successors except the project deadline, it can delay several weeks, and no other activities will need to be adjusted
Step 7: Identify the Critical Path
Critical path is the network path that has the longest duration in a project or work package.
- formula:
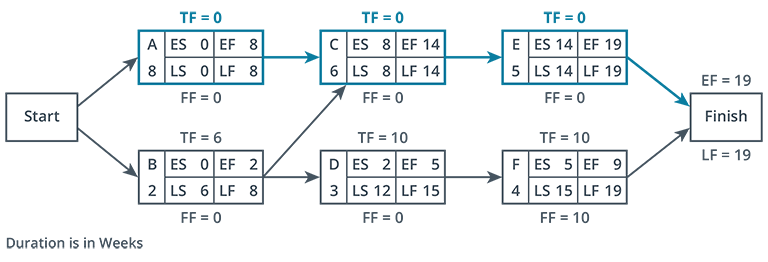
Usefulness of CPM Outputs
- CPM delivers four valuable outcomes:
- Project duration
- project can finish in 19 weeks
- Critical path
- A-C-E are on the critical path
- Total Float (TF)
- Activities B, D, and F have plenty of flexibility
- Free Float (FF)
- Activity F is the only activity that can shift the timeline without impacting other activities
- Project duration
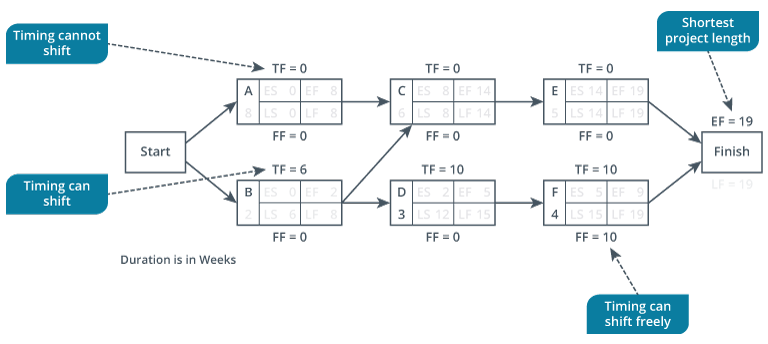
- final look at the critical path diagram shows where the project can adjust and where it must maintain course