Control Charts
Control chart is a graph that is used to analyze and communicate the variability of a process or project activity over time.
- statistical charts that track the variation in a process
- shows if the process is performing as it usually does
- process performance is:
- in control
- has an acceptable amount of variation
- out of control
- unacceptable levels of variation
- in control
- looks like a run chart with additional data
- is a time-based line graph
- has 3 elements:
- center line is the mean of the actual values graphed
- upper control limit (UCL)
- shows the highest expected value for the process, assuming everything is under control
- lower control limit (LCL)
- shows the lowest expected valued for the process, assuming everything is under control
- 99% of results should occur within the control limits
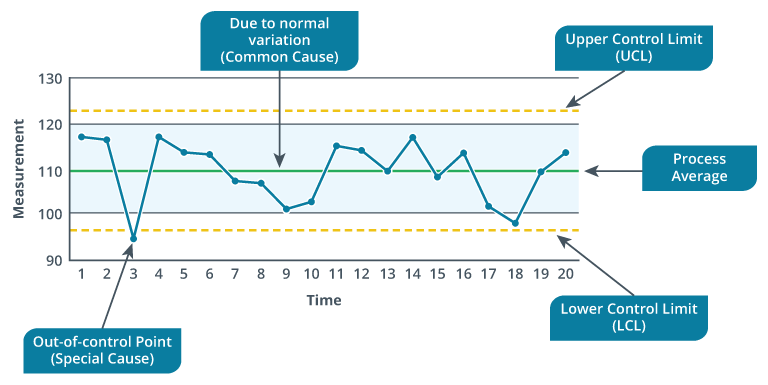
- expect to have points varying above and below the mean line
- rule of 7 states that any 7 consecutive points on the same side of the mean line means there is imbalance