Combination Chart
Combination chart is a chart that combines columns and lines to compare one or more data points (columns) against a trend (line).
- allow us to utilize a secondary axis
- can be used when the gaps between two sets of numbers are so large that the distance makes it hard to read the chart purely from a visual standpoint
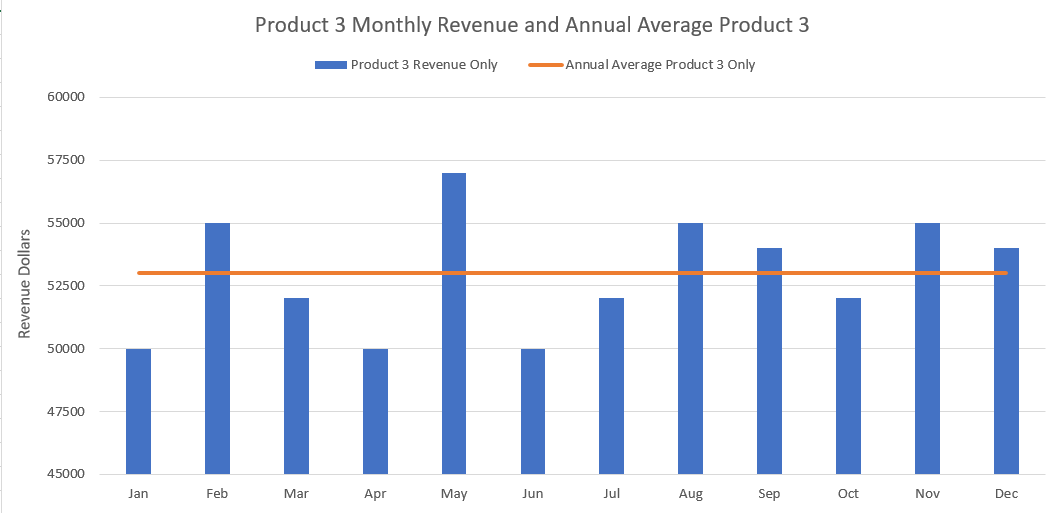
- compares the performance of Product 3 against its annual average
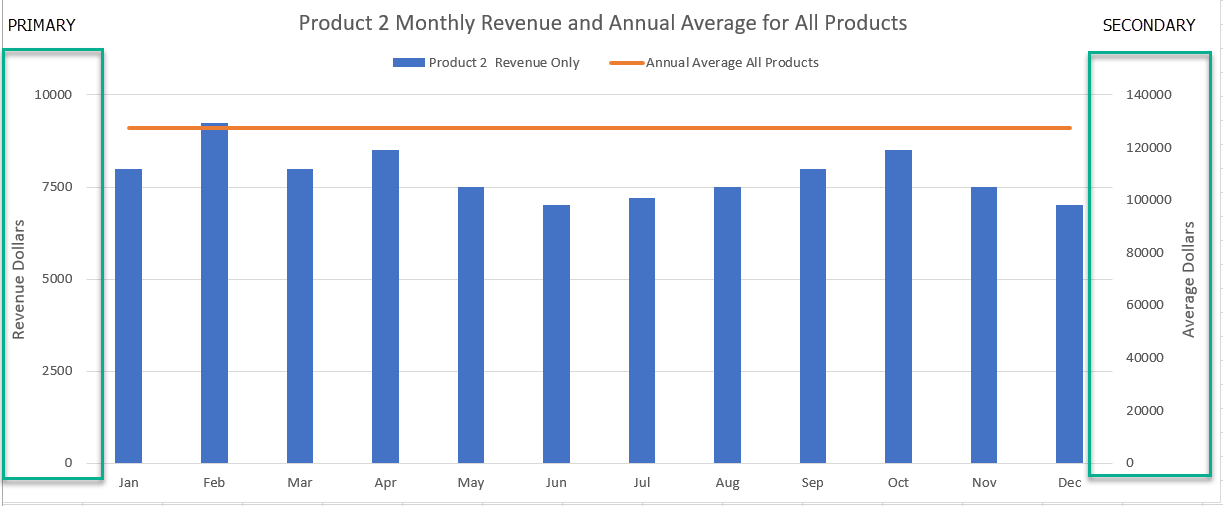
- Dual axis combo charts can create misleading scales,
- because people might assume these axes directly comparable,
- giving an impression of a relationship between the variables
- should be used very carefully
- because people might assume these axes directly comparable,