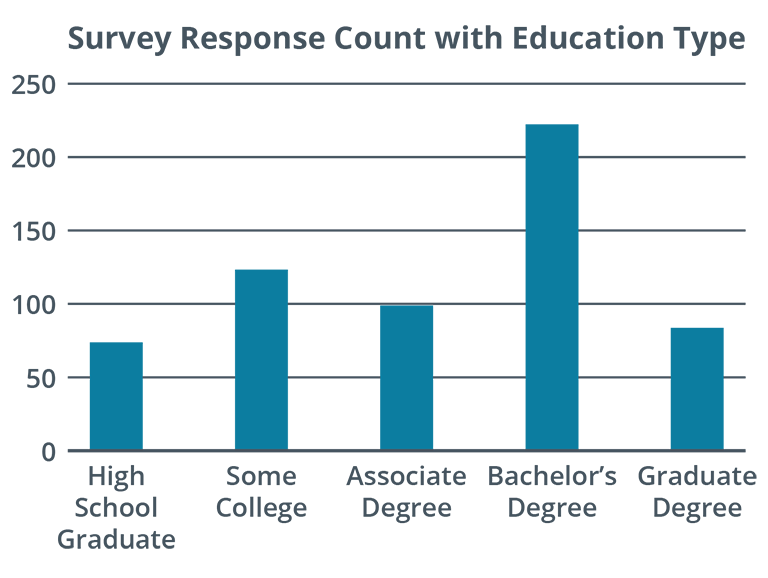
Column Chart
Column chart is a chart that displays information, listing the categories on the x-axis (horizontal axis) and the discrete values on the y-axis (vertical axis).
- used to display the distribution of data
- useful when we need to display ordinal information
- often used to show revenues, sales, or other information consisting of dollar amounts
- allows us to isolate and quickly compare each time period
- some people might prefer line graphs for this type of information