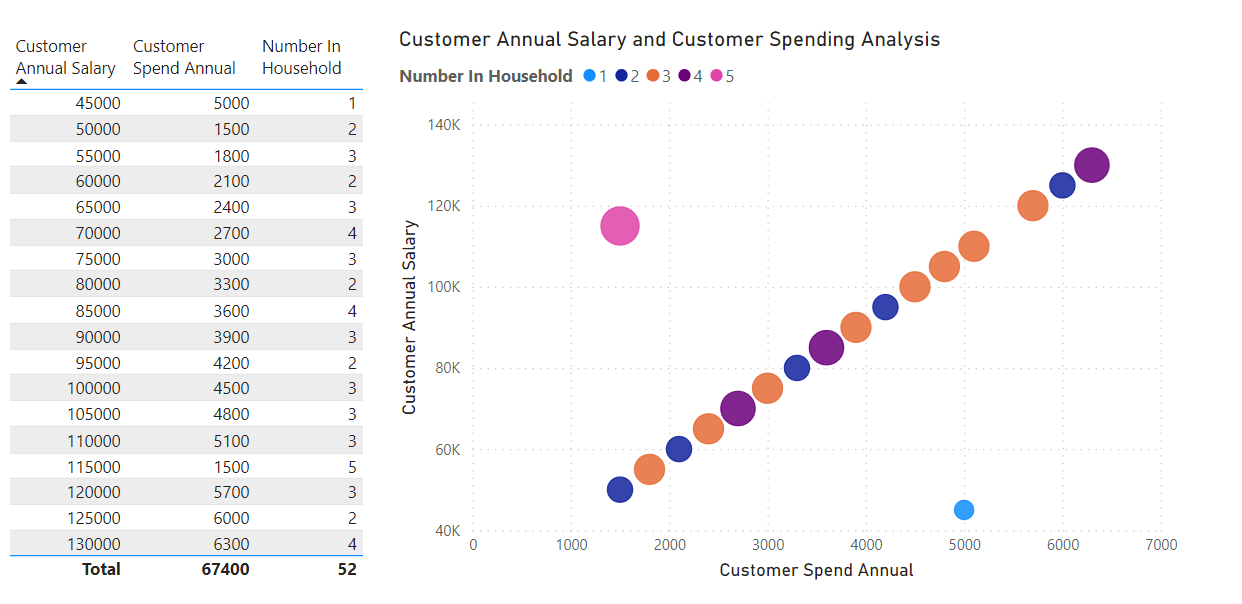
Bubble Chart
Bubble chart is a visual that plots points on an x/y axis similar to a scatter plot, but with the addition of the size of the dot representing a third variable.
- useful visualizations when you want to assess for an existing relationship between two variables
- can provide additional insight into what additional factors may contribute to the presence of outliers